

![]()
![]()
Why CIE94?
Given that there are several color difference formulas, one may very wonder which we should use for video calibration? This is not a merely academic question. The problem is that these formulas can provide different results, sometimes radically different results. Let’s take one example to illustrate this difficulty.
Consider the three green boxes below.
 |
 |
 |
| Sample 1: Saturation Difference | Sample 2: 1976 ΔE Equivalent | Sample 3: 1976 ΔE Optimized |
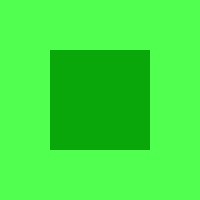
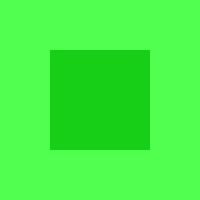
The first green box in Sample 1 surrounds a smaller green center that is more highly saturated. The difference between the high saturation center and the lower saturation surround is easily visible. In the middle Sample 2, the surround remains unchanged, but the luminance of the oversaturated green in the center has been reduced substantially. In Sample 3, the surround is again unchanged, but this time the luminance of the oversaturated green box in the center has been reduced, but to a smaller degree than in Sample 2.
These samples help illustrate how different ΔE formulae can yield quite different results. According to either of the 1976 formulas, the color difference observed in Sample 1 can be substantially lessened by lowering the luminance of the oversaturated color. Sample 3 roughly shows what the 1976 formula predicts is the lowest color difference achievable by lowering the luminance of the oversaturated center. These swatches are only approximations, but the theoretical model bears this out. Compare two shades of green, the Rec. 709 high-definition specification and an oversaturated sample:
- Rec. 709 Green: x0.300, y0.600, Y0.715
- Oversaturated Green: x0.296, y0.676, Y0.715
According to the CIELUV color difference formula, the ΔE between these two samples is 23. If we do nothing more than lower the luminance of the oversaturated green to
x0.296, y0.676, Y0.540,
then, according to CIELUV, we reduce the color difference to just over 11. In other words, CIELUV predicts that a 25% reduction in luminance alone from this oversaturated green results in a 52% reduction in color difference between it and the Rec. 709 reference. This is what Sample 3 above illustrates. Even more startlingly, if you reduce the luminance even further to
x0.296, y0.676, Y0.383,
then the color difference is equal to what it was in the original sample. In other words, CIELUV predicts that a 48% reduction in luminance alone from this oversaturated green has no effect on perceived color difference between it and a Rec. 709 reference. This is what Sample 2 above illustrates.
The interesting aspect of this is that the more recent ΔE formulas—CIE94 and CIEDE2000—predict something very different. Consider Figure 3 below, which shows the effect on color difference between a Rec. 709 reference (of x0.300, y0.600) and the same oversaturated green (x0.296, y0.676) as luminance is lowered from a reference level of Y0.715 to Y0.383.
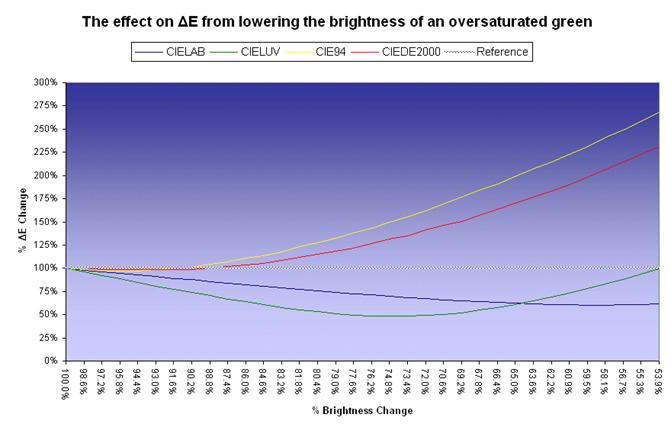
This graph shows that the 1996 and 2000 ΔE formulas predict very different results from either of the 1976 formulae. According to either CIE94 or CIEDE2000, reducing the luminance of an oversaturated green (the effect is similar for red) is a counterproductive method for reducing color error. In contrast, the 1976 color difference formulas (CIELAB or CIELUV) predict that reducing luminance from an oversaturated sample by 35% lowers ΔE by approximately 31%. However, CIE94 predicts that reducing color luminance this much for the same color nearly doubles the color difference! The CIEDE2000 prediction is only slightly less dramatic.
It is important to emphasize that these stark differences are limited to measurements of the primary and secondary colors. Interestingly, when assessing the color of white, the various formulas perform much the same. The only small difference is that CIELUV scales higher than the Lab-based alternatives (CIELAB, CIE94, and CIEDE2000).
The various formulae vary not only with respect to their treatment of luminance. They weight the contribution that each primary color has in determining the total color difference between two gamuts. The differences in the two most common gamuts, standard-definition SMPTE-C and high-definition Rec. 709, are shown below.
Red |
Green |
Blue |
|
| CIELUV | 54% |
29% |
18% |
| CIELAB | 28% |
28% |
44% |
| CIE94 | 26% |
26% |
48% |
| CIEDE2000 | 32% |
23% |
45% |
As you can see, the four color difference formulas treat green similarly, but CIELUV treats red and blue quite differently from the Lab-based alternatives. CIELUV assigns over half of the total color difference between the SMPTE-C and Rec. 709 gamuts to red and less than one-fifth to blue. In contrast, CIELAB, CIE94, and CIEDE2000 each distribute the color difference more evenly, with blue offering the greatest contribution.
Is ΔE all we have?
Given the sheer proliferation of different ΔE formulas and considering that these formulas offer somewhat different results, a ΔE result using one formula may mean something totally different than the same ΔE in a different formula. Another problem with ΔE as a measurement of color difference is that it provides a single number, which can represent a larger or smaller perceptual error depending upon the color being viewed and whether the difference in question is one of saturation, hue, or lightness. Our eyes are not equally sensitive to these errors and the different formulas accommodate them differently.
In response to this problem, in addition to ΔE there are at least two other metrics for reporting color error. Both are precise and uniform. The first is % error in hue, saturation, and lightness. Simply reporting that a shade of red has a CIE94 value of 2.4 is not as informative as knowing that it has errors in H (0.0%), S (1.4%), and L (-4.4%). This tells us that the shade of red is too dim, slightly oversaturated, and with a correct hue.
The second method of reporting color difference is % error in RGB. All color is a combination of red, green, and blue. Thus, all of the primary and secondary colors can be defined in terms of unique mixes of RGB. Once we have those mixes, then we can understand color error as a % deviation from the appropriate mix.
| Color | R |
G |
B |
| Red | 100% |
0% |
0% |
| Green | 0% |
100% |
0% |
| Blue | 0% |
0% |
100% |
| Yellow | 100% |
100% |
0% |
| Cyan | 0% |
100% |
100% |
| Magenta | 100% |
0% |
100% |
Let's assume that the same color mentioned above with errors of H (0.0%), S (1.4%), and L (-4.4%) is green and we are working in a Rec. 709 high-definition gamut. This color has an RGB error R (-0.7%) G (-10.8%) B (-0.7%). There are strengths and weaknesses to the RGB approach. As this example shows, it isn't nearly as intuitive HSL errors. What does insufficient green (-10.8%) in green mean? It is not obvious, but it means that the shade of green is too dim.
However, the RGB approach is also probably more precise. For example, let's consider again the oversaturated green from the beginning of this article:
x0.296, y0.676, Y0.7152
The HSL analysis of this color is H (0%), S (16.9%), L (0%). This clearly captures the fact that the color is oversaturated but otherwise accurate.
However, the RGB analysis of this color is
R (-10%)
G (4%)
B (-10%)
This analysis tells us that to correct the color we must add equal amounts of red and blue to desaturate the green to its correct point, which is what we would expect. However, it tells us something else that is not expected. This analysis also suggests that—given the relatively low levels of red and blue—the shade of green is slightly too bright (remember, an excessive amount of a color in the same color—in this case an excessive amount of green in green—means that it has excessive luminance).
The bottom line is that the RGB analysis tells us that to minimize color error without changing the saturation we should lower the luminance from Y0.7152 to Y0.6885, which would provide RGB values of
R (-10%)
G (0%)
B (-10%)
In contrast, the HSL analysis says that doing so will only increase color error by raising the Lightness error from 0% to -1.5%. Which is correct?
This analysis sheds an interesting light on the various recommendations of the ΔE formulas. If we want to minimize color error without changing the saturation of this oversaturated sample, the HSL analysis recommends leaving the luminance alone, whereas the RGB analysis recommends lowering it slightly.
We can see from the discussion above that neither of the 1976 formulas concur. If we wish to minimize the error of the oversaturated sample without changing the saturation both CIELUV and CIELAB recommend that we substantially lower the luminance. Neither of these recommendations are consistent with the HSL or the RGB analysis of the optimum luminance of the oversaturated green.
On the other hand, take a look at CIE94. It predicts that to minimize color error without changing saturation, the optimum luminance of this oversaturated green would be somewhere between Y0.701 and Y0.674, which is directly in line with the RGB analysis that the optimal luminance for this oversaturated shade of green is Y0.6885 or 4% below the Rec. 709. standard.
Thus, if a display has an oversaturated color, but you have no means to correct this, you can improve overall accuracy by lowering the luminance of that oversaturated color slightly (for example, by lowering the main Color control a couple of ticks). This is what both the RGB and the CIE94 analysis recommend. For this reason, I recommend CIE94 as the preferred ΔE formula for assessing the color performance of quality displays.